Q2 2024 Performance Numbers and Audience Insights
Each quarter, we gather aggregate email engagement stats from our media industry clients who use Omeda email tools as part of their integrated audience platform subscription. The unique insights provide an unmatched ability to see what’s driving results, benchmark your performance, and adjust next quarter’s email strategy and campaigns. This report analyzes data from nearly 2 billion emails from the Omeda audience platform during Q2 2024.
Here’s what you can expect in this report:
- Our analysis of why open rates dropped in Q2 2024
- A performance breakdown for each deployment type
- An interview with Todd Peterson, Senior VP of Audience at Farm Journal, on Gmail’s most recent security and sorting changes — and their implications for publishers like you
Read on to discover what’s driving engagement and conversions:
Overall quarterly performance change
- # of email deployments: (1,984,523,681, +16% from Q1 2024)
- Delivery rate: 99.02%, up from 98.77% in Q1 2024 (+0.25% relative)
- Total open rate: 43.23%, down from 49.57% (-12.79% relative, -6.34% absolute)
- Unique open rate: 30.10%, down from 33.44% (-9.99% relative, -3.34% absolute)
- Total click rate: 2.29%, down from 2.57% (-10.89% relative, -0.28% absolute)
- Unique click rate: 1.46%, down from 1.65% (-11.51% relative, -0.17% absolute)
- Total CTR: 5.30%, up from 5.18% (+2.32% relative, +0.12% absolute)
- Unique CTR: 4.83%, down from 4.92% (-1.83% relative,-0.09% absolute)
- Unsubscribe rate: 0.091%, down from 0.112%
- Complaint rate: 0.005%, no change
(Some quick methodology notes: For additional context, we measure both the relative and absolute change in performance each quarter. We use the percent change equation to find the relative change. To find the absolute change, we find the raw difference between the new and old percentages. Also, all references to “click rate” and “click-through rate” in this report refer to the average unique click rate and CTR among all Omeda clients.)
Email engagement among Omeda clients has steadily risen for the last few quarters, capped off by a 17% increase in click rates and CTR in the previous quarter.
However, engagement fell off significantly this quarter. The average unique open and click rate among Omeda clients fell by about 10% and 11.5%, respectively.
We’ve seen double-digit variations in click rates before: Click rates rose by 17% last quarter, by 9% in Q1 2023, and dropped by 12% in Q4 2022.
However, open rates typically only fluctuate between 1-4% in any given quarter.
This isn’t a media industry-specific issue, either: Senders across industries, sending platforms, and list sizes have also reported that their open rates are dropping.
Sure, some may have neglected to authenticate their domains or clean their lists. But we’re also seeing this among Omeda clients with authenticated domains, minimal spam complaints, and a solid track record of high engagement.
So what’s going on? We think there are a few different variables at play. Below, we’re breaking down each one to better understand what’s impacting industry email performance.
Sending volume skyrocketed in Q2. Historically, we’ve seen an inverse relationship between sending volume and overall email performance. For example, clients sent nearly 8% fewer emails between Q4 2023 and Q1 2024, and the average unique open and click rate for Omeda clients went up by 2.63% and 17.02%, respectively.
This quarter, that correlation worked in reverse: Our clients sent nearly two billion emails in Q2 — a 16% quarterly increase over Q1 (or 200 million additional emails).
There are a lot more factors at play, as you’ll see below, but we think at least part of the decrease can be explained by increased volume.
ISPs are cleaning their databases more aggressively. Our deliverability team reports that M3AAWG senders are seeing a decline in open rates on Yahoo and AOL as well. That’s because Yahoo/AOL has been purging more inactive accounts this summer — and the rate of prefetching/caching images may be decreasing. (Putting off your database cleanup? Here’s your sign to get started.)
The impact of Google and Yahoo’s anti-spam enforcement and sorting changes. In February, Google and Yahoo released new anti-spam requirements, which would penalize senders by diverting their emails to spam if they didn’t have authenticated domains or their regularly exceeded its spam threshold of 0.3%
So when we noticed open rates dropping this quarter, we thought that these new anti-spam requirements might be hurting our clients’ deliverability more than we originally forecasted.
But if that were the case, we’d expect to see delivery rates decrease alongside open rates. That didn’t happen. Delivery rates have actually slightly improved since last quarter (shoutout to everyone who cleaned their lists in advance of the enforcement). Unsubscribes and complaints have stayed consistent as well.
Another data point: Almost all of our most successful newsletter senders (as measured by unique click rate) saw their open and click rates decrease in Q2.
So if deliverability hasn’t been the issue, what happened to open rates this quarter?
Our theory: This spring, as Google and Yahoo began enforcing their new anti-spam requirements, you may have also noticed that your daily newsletter started getting sent to your promotions folder more frequently. Or that emails from trusted senders started getting sent to your secondary folders.
We don’t think that’s a coincidence. We think that, in concert with their new anti-spam enforcement, Gmail and other ISPs also updated their inbox sorting algorithms, so they would divert more newsletters and marketing emails to category folders, like promotions and updates, where they’re less likely to be seen and opened.
If that were the case, we’d expect open rates to drop starting in February. As more emails get diverted to secondary folders, some of the audience fails to check them and open them. And as future emails from those senders get lower and lower engagement, even more emails will be diverted to those folders, and open rates will continue to decline.
With one or two exceptions for specific deployment types, that’s exactly what’s happening: Open rates across almost every deployment type have steadily declined every month from February to June 2024.
Click rates have followed a similar, albeit imperfect, trend.
What’s behind the drop in open rates? Our conversation with Todd Peterson of Farm Journal
To better understand what’s happening, we turned to a seasoned media audience executive working on a trusted portfolio of brands: Todd Peterson, Senior VP of Audience at Farm Journal.
Our questions for him: As a sender, how can you navigate the impact of these changes? How can you maintain good inbox placement and open rates as sorting algorithms become more sophisticated? And how can you stay connected to your audience, no matter what channel they’re on? Peterson tackles all that and more below.
First off, have you noticed any changes to your email engagement trends in the last 6 months? And if so, what do you think is driving the trend?
Peterson says he’s seeing the same trend as detailed in the Q2 2024 email benchmark report. Farm Journal’s email engagement has also fluctuated in the last six months, but their click rates and deliverability remain consistent.
He attributes some of the variation to Gmail’s new sorting methods, which he’s noticed in his own inbox.
“We do have so much Gmail traffic within the entirety of our list that every time Google changes how they sort, I’ve always seen some [engagement] drop somewhere,” he says.
However, their click rates have also held steady, which he attributes to improved design, subject lines, copy testing, and engaging new subscribers more proactively.
How can senders mitigate the impact of Google’s Gmail changes?
Optimize for depth, not breadth. Peterson predicts senders will optimize for attention metrics rather than opens, clicks and click-throughs.
“At some point, the quantity that everyone worries about will go down,” he says. “And open and click rates may go down but attention metrics will rise and become more important.”
Also, consider the quality of your opens and clicks. When someone subscribes, do they continue to engage over weeks and months? Or do they churn once they get a discount code? If you’re constantly burning through subscribers, your open rates and deliverability will suffer for it eventually.
“If you’re only focused on optimizing your content for opens and clicks, you might not realize those engagements never lead to conversions (however, you’re defining conversion). Or you might notice that people open, but then quickly unsubscribe or mark your email as spam once they’ve gotten their one-time use coupon code,” deliverability expert Lauren Meyer says.
She recommends looking beyond open and clicks to consider your subscriber lifecycle more holistically.
“Consider the bigger picture (data collection, content strategy, targeting) to ensure you’re using the right lead magnets to bring the right people to your signup form. Properly set expectations about what they’ll get from you and how often. And look at your performance metrics over time so you can send content that the data supports they engage with and seem to find value in.”
Provide clear whitelisting instructions at multiple points in your sign-up flow. Peterson shares that not enough senders are including whitelisting instructions in their welcome emails.
“Communicate with your audience – starting with the first email outreaches – the best ways that you as a reader can get emails in your inbox every time,” Peterson says.
If your open rates are falling, that’s an excellent place to start. You can ask readers to add you as a contact or manually move your emails from secondary to primary folders. (We’ve got step-by-step instructions for this on Gmail and Outlook here.)
But it’s not enough to just ask someone to remove you from their secondary folders. The best senders use their whitelisting instructions to emphasize value to the reader and encourage deeper interaction. Here’s how to create whitelisting processes that grab your audience’s attention and keep them engaged with your brand:
- Provide proof of concept before asking your audience to whitelist you. Your audience is more likely to whitelist your emails if you’ve already shown them the value you can provide. Do that in your welcome series by presenting your credentials, providing an excerpt of your latest premium piece, or linking to additional resources.Don’t be shy: There’s a time and place to cut copy. And this isn’t it.Here’s a great example from Axios Media Trends from Sara Fischer, who uses her extensive media reporting experience to comment on current media industry trends.

- Use a light, pleasant, and appreciative tone. This primes someone to view the task as simple rather than an inconvenience. My favorite example comes from Lauren Meyer’s Send it Right newsletter. You’d expect someone with a newsletter on deliverability to really nail this email and she does, with a matter-of-fact but warm voice.

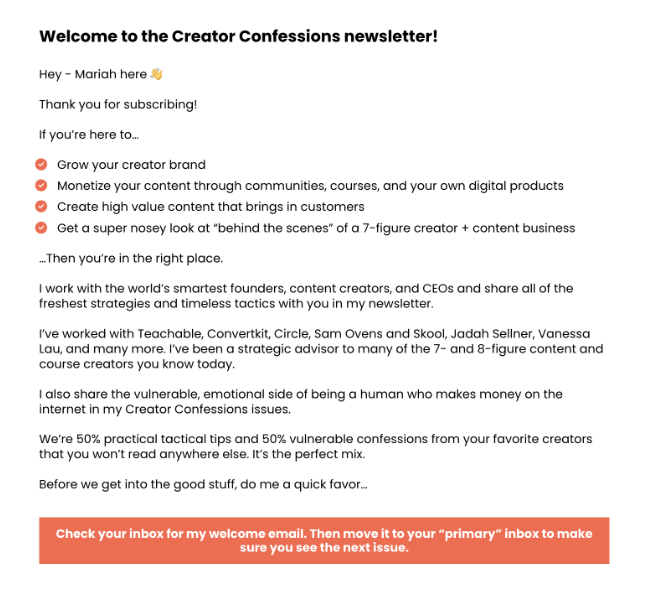
- Include whitelisting instructions at multiple points in your subscriber lifecycle. For instance, Mariah Coz of the Creator Confessions newsletter tells readers how to find her emails on her subscription confirmation page, then adds more instructions in her welcome email.


Also, consider providing whitelisting notes in your standard email header and footers, as well as your re-engagement campaigns. As algorithms become more sensitive, they may divert your emails to secondary folders if someone misses a few emails in a row. - Use design to emphasize your whitelisting instructions. Draw the reader’s eye to your whitelisting instructions using a different, bright color or arrows to list the instructions.

Encourage your audience to reply to your emails. When someone replies to your email, they’re essentially “telling” their ISP that they want to keep seeing your messages in their primary inbox.
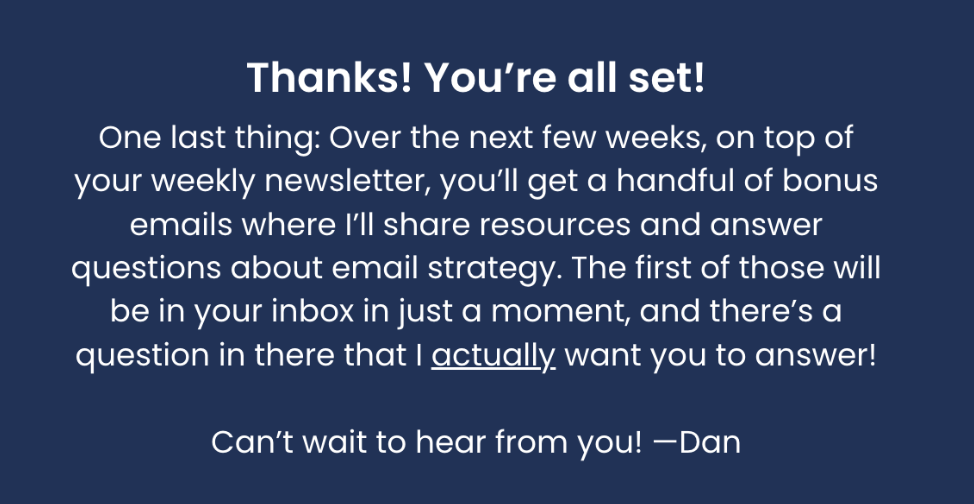
A pro tip is to ask your audience questions and encourage them to reply, or just invite free-form replies in your sign-up slow and welcome series. But if you’re just doing this to improve deliverability, your audience will see through it. Instead, make it clear you care about your audience’s feedback — and ask the questions that’ll help you improve their experience. This example from Dan Oshinsky’s Inbox Collective strikes that tone perfectly.
Replies don’t just help you reach your audience. They give you the information you need to create more relevant content, enhance your product, and ultimately, keep your audience invested long after they first hit subscribe.
Manually replying to subscribers might be time-consuming, but it pays off in the form of a more passionate audience and improved engagement.
Case in point: Tim Huelskamp, CEO and founder of 1440, says that replying to almost every reader’s email has helped them achieve a 60% daily open rate even as they scale to 3 million subscribers. And more importantly, it’s helped him “stay connected to the heart of the business.”
We’ll let Tim Huelskamp, their CEO and founder, explain from here:

Complement email with on-site personalizations, SMS and other channels, especially for time-sensitive campaigns. We’re not expecting transactional emails to get filtered as often as newsletters and standard promotions. But the ISPs aren’t perfect, so it’s worth building extra steps into your automated subscription renewal and payment campaigns.
A few other pro tips to consider:
- add another email to your flow in case the first goes to a secondary folder.
- replace one of your emails with a text reminder or on-site personalization. Mix and match to see what works best for your audience.
Performance by deployment type
Deployment type breakdowns
Events
(Includes events, live conferences, virtual conferences and webinars)
- Unique open rate: 25.95% (-10.52%, down from 29.00% in Q1 2024)
- Unique click rate: 0.70% (-16.67%, down from 0.84%)
- Unique CTR: 2.68% (-7.59%, down from 2.90%)
Events subcategory
- Unique open rate: 25.57% (-14.68%, down from 29.97%)
- Unique click rate: 0.79% (-1.25%, down from 1.25%%)
- Unique CTR: 3.08% (+15.36%, up from 2.67%)
Live conferences subcategory
- Unique open rate: 20.16% (-5.04%, down from 21.23%)
- Unique click rate: 0.46% (+76.92%, up from 0.26%)
- Unique CTR: 2.28% (+83.87%, up from 1.24%)
Virtual conferences subcategory
- Unique open rate: 21.93% (-19.96%, down from 27.40%)
- Unique click rate: 0.58% (-4.92%, up from 0.61%)
- Unique CTR: 2.63% (+18.47%, up from 2.22%)
Webinar subcategory
- Unique open rate: 27.07% (-7.39%, up from 29.23%)
- Unique click rate: 0.66% (-33.33%, down from 0.99%)
- Unique CTR: 2.45% (-27.51%, down from 3.38%)
Misc Comms
(Includes any communications that don’t fit into the other deployment categories)
- Unique open rate: 30.83% (-5.75%, down from 32.71%)
- Unique click rate: 1.06% (no change)
- Unique CTR: 3.45% (+6.48%, up from 3.24%)
Surveys & Research
(Includes reader service, research and surveys)
- Unique open rate: 27.49% (-13.80%, down from 31.89%)
- Unique click rate: 0.65% (-16.67%, down from 0.78%)
- Unique CTR: 2.37% (-2.87%, down from 2.44%)
Newsletters
(Includes digital magazines and newsletters)
- Unique open rate: 31.15% (-10.57%, down from 34.83%)
- Unique click rate: 2.00% (-11.50%, down from 2.26%)
- Unique CTR: 6.42% (-1.23%, up from 6.50%)
Promotions
(Includes advertiser promotion, audience promotion, marketing, third-party and white papers)
- Unique open rate: 29.84% (-8.75%, down from 32.70%)
- Unique click rate: 0.85% (-4.49%, down from 0.89%)
- Unique CTR: 2.86% (-4.76%, down from 2.73%)
All other promotional subcategories (advertiser promotion, audience promotion and marketing subcategories)
- Unique open rate: 29.57% (-9.96%, down from 32.84%)
- Unique click rate: 0.83% (-11.70%, down from 0.94%)
- Unique CTR: 2.81% (-1.14%, down from 2.25%)
White papers
- Unique open rate: 32.39% (-4.90%, down from 34.06%)
- Unique click rate: 0.72% (-1.37%, down from 0.73%)
- Unique CTR: 2.23% (+4.70%, up from 2.13%)
Third party
- Unique open rate: 29.94% (-6.09%, down from 31.88%)
- Unique click rate: 0.97% (+22.78%, up from 0.79%)
- Unique CTR: 3.25% (+31.05%, up from 2.48%)